Fluentd → Status200
Обзор
Fluentd собирает логи; плагин http output шлёт их в HTTP endpoint Status200.
С чего начать
Fluentd поддерживает сотни источников — Docker, Syslog, веб-серверы, БД, языки и т.д. Список: datasources.
Требования
- Установка Fluentd: installation.
- Аккаунт Status200; приём логов — платный, см. pricing.
- Проект в dashboard; support@status200.ru при вопросах.
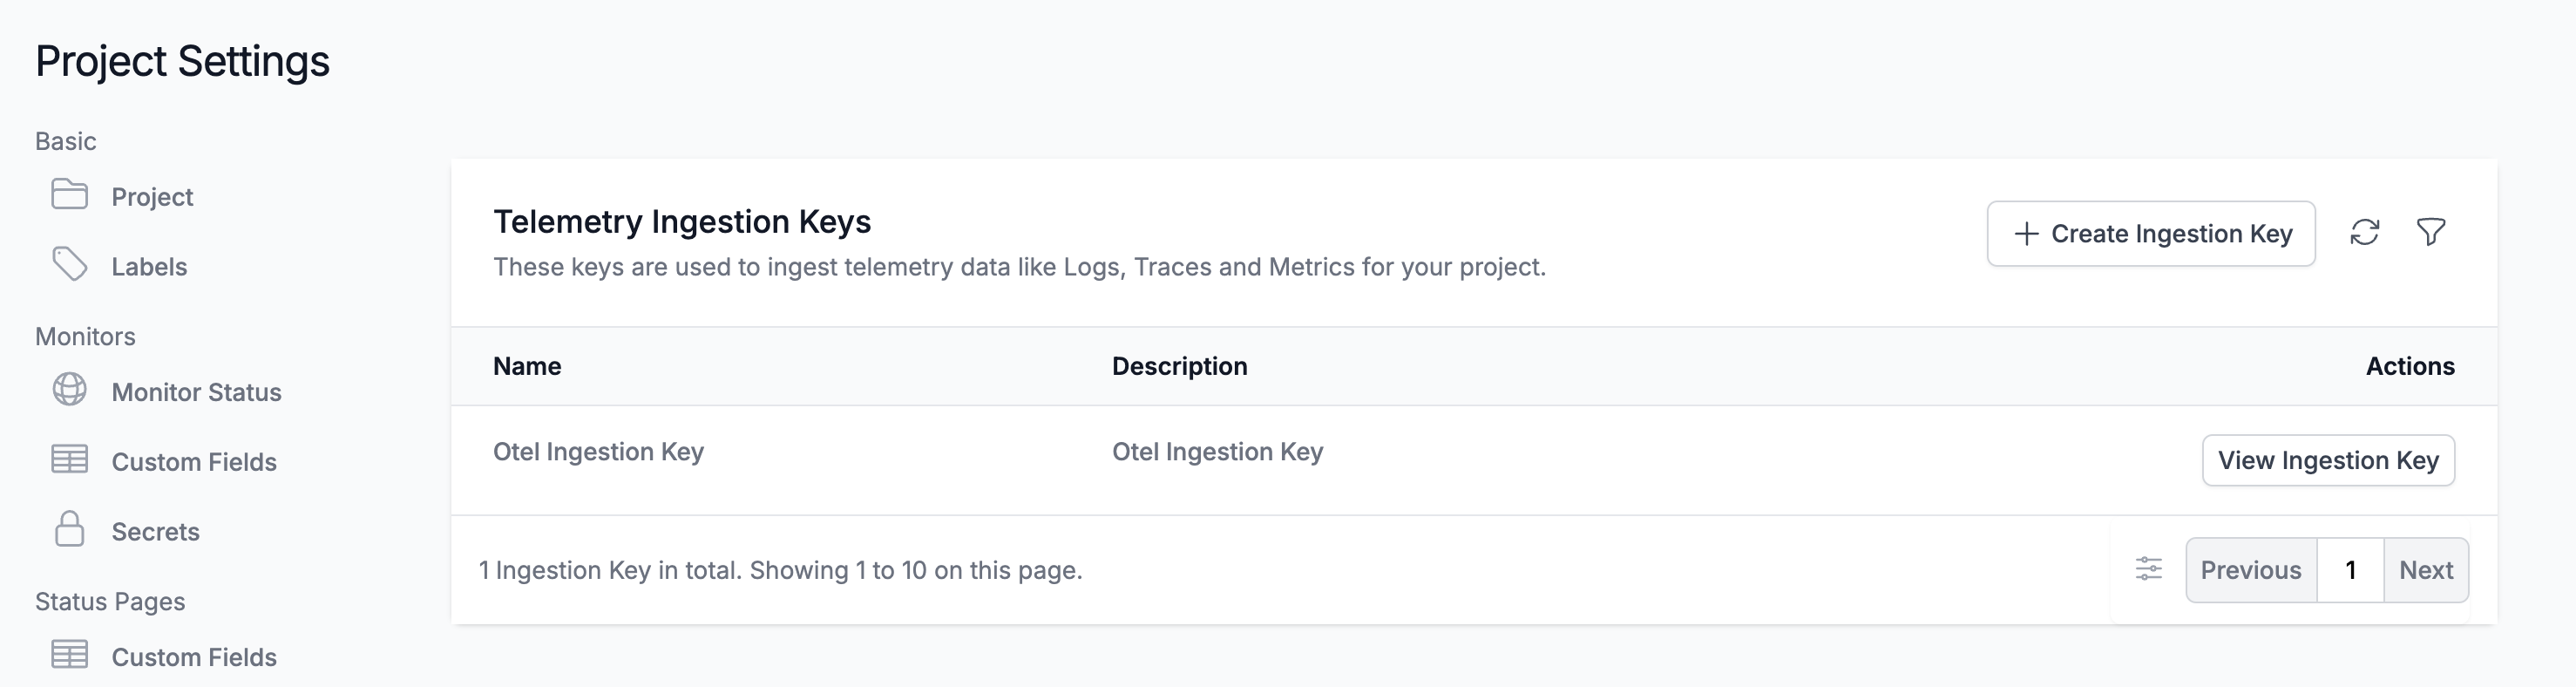
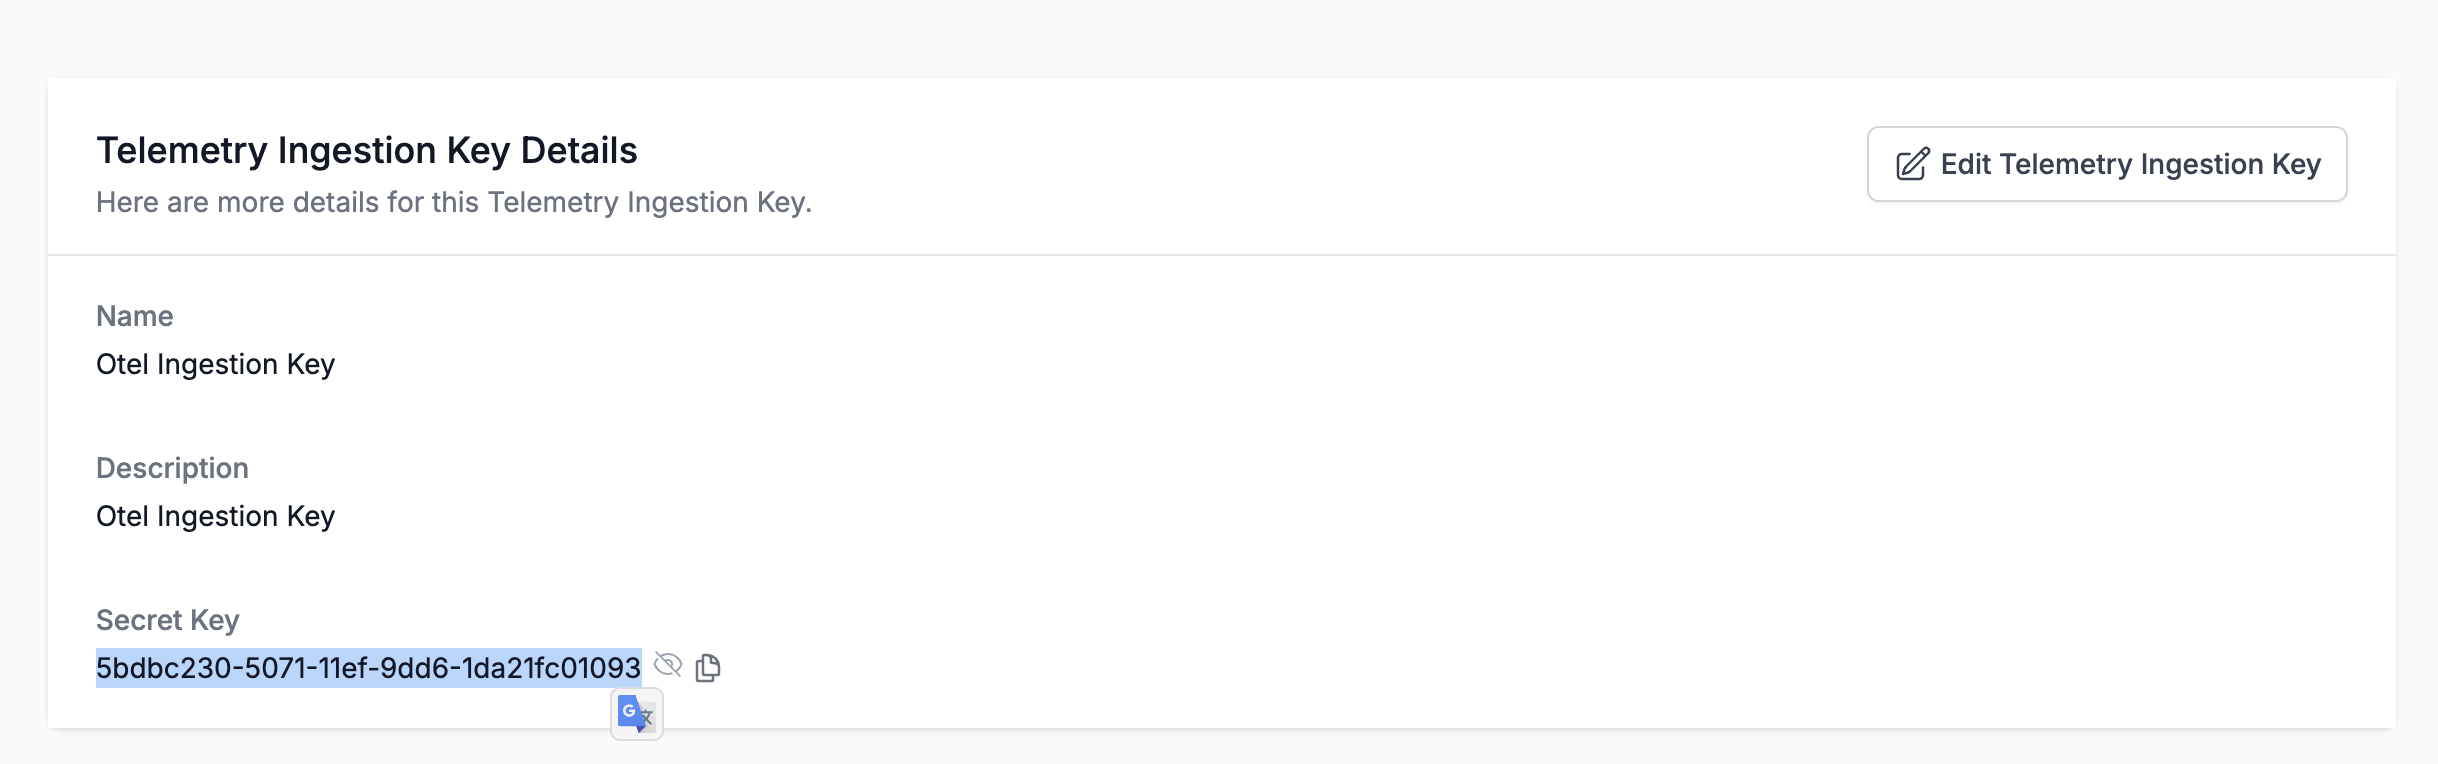
- Telemetry Ingestion Key: More → Project Settings → Create Ingestion Key → View.
Конфигурация
Файл обычно /etc/fluentd/fluent.conf или /etc/td-agent/td-agent.conf.
Замените YOUR_SERVICE_TOKEN и YOUR_SERVICE_NAME. Если сервиса ещё нет в Status200, он создастся автоматически.
<match **>
  @type http
  endpoint https://status200.ru/fluentd/logs
  open_timeout 2
  headers {"x-status200-token":"YOUR_SERVICE_TOKEN", "x-status200-service-name":"YOUR_SERVICE_NAME"}
  content_type application/json
  json_array true
  <format>
    @type json
  </format>
  <buffer>
    flush_interval 10s
  </buffer>
</match>
Полный пример с forward input:
<source>
  @type forward
  port 24224
  bind 0.0.0.0
</source>

<match **>
  @type http
  endpoint https://status200.ru/fluentd/logs
  open_timeout 2
  headers {"x-status200-token":"YOUR_SERVICE_TOKEN", "x-status200-service-name":"YOUR_SERVICE_NAME"}
  content_type application/json
  json_array true
  <format>
    @type json
  </format>
  <buffer>
    flush_interval 10s
  </buffer>
</match>
Self-hosted: endpoint → http(s)://YOUR_STATUS200_HOST/fluentd/logs
Запуск
Перезапустите Fluentd; логи в dashboard. Поддержка: support@status200.ru